
In my last post, I talked about some of the considerations of taking data and how much data is enough. Data, like most things in teaching, has to be individualized depending on the skills being taught, how they are being taught, and what works in the setting. Less data taken reliably is better than more data taken haphazardly. And like many things in autism, good data collection is all about setting up systems. So, I thought I would talk a little more about the data sheet I shared in the last post and two ways I use it in the classroom.
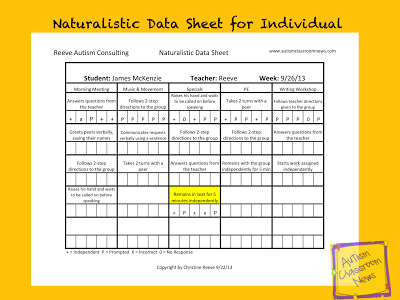
I talked about (and shared) this data sheet in the last post, but I wanted to give you some more detail about how I use it. If I have a student who is primarily included or who is the only student I’m tracking in many environments (even if much of his or her time is in resource), I will use the data sheet to track that student’s behavior across settings. That data sheet might look like this:

For this student, I would take data on a row each day, meaning that one skill would be targeted for data collection in each activity. All the skills will be taught everyday, but the data will only be collected once a week. Each of the smaller boxes represents an opportunity for him to demonstrate the skill. There are 5 boxes so that 5 opportunities can be tracked. Five is not a magical number, it just works for size on the sheet and figuring percentages. However, if you have more than 5 opportunities, record them in the big box when you run out of small ones. If you have less, that’s fine, but keep in mind that students with autism need frequent practice of skills to master them, so the more opportunities you create, the more progress you will see. I like to aim for at least 5 opportunities in an activity for most skills; although for some skills it wouldn’t’ be appropriate. As you can see, some of the skills overlap and are repeated on several days so we have several samples at the end of the week. This data sheet would follow the student on a clipboard throughout his day and is a good reminder to the staff about what skills they are supposed to teach (i.e., create opportunities for practice) even though data isn’t collected on each skill each day.
I highlighted “Remains in seat for 5 minutes independently” because for that skill in each of the smaller boxes I took data for 5 minutes of the activity (which happens to be 25 minutes long, but you can add or subtract boxes accordingly). So for the first 5 minutes of specials on Thursday (4th row down), he independently stayed in his seat. For the next 5 minutes he needed at least 1 prompt. He was independent in the next 5 minutes. He got out of his seat and didn’t respond to prompts in the next 5 minutes (hence the X for incorrect) and then he stayed in his seat with a prompt for the last 5 minutes. And yes you will need a timer, but if you use a smartphone you can probably set it to vibrate instead of ring every 5 minutes to prompt the data collector.
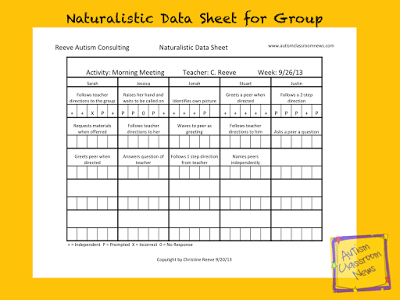
The other way to use this data sheet is to track behaviors of multiple students in a group. In that case, it is set up like the one below.

In this situation, each column lists one student’s goals for morning meeting. Data can be taken on one student per day (i.e., down a column) or one skill per student each day (i.e., across the row). Again, the small boxes represent opportunities to exhibit the skill. If you have more just write around them. Only data for 1 day is taken on this example and it was taken by recording progress on one targeted skill for each student during morning meeting. Keep in mind, again, that every skill is taught everyday but only recorded in a sample. This data sheet would stay in the morning meeting area and someone would be zoned to take data during morning meeting. Again the sheet is a good reminder about what skills to teach during morning meeting and might change over time as the student’s progress is assessed.
On these sheets because you are taking data on multiple things simultaneously while trying to keep students engaged in a naturalistic situation, I usually don’t take detailed prompt data unless I need it for analyzing a problem. The key works for me, but as long as your team is all using the same designations (e.g., P for prompted; + for correct) then you can use whatever symbols work for you. Also, I will sometimes break skills down into teaching steps and designate those steps on the data sheet. So, if Sarah has a goal to name her colors and in discrete trials, she has mastered blue and green, I might just target those two on her morning meeting data sheet and the skill might be written as “Correctly names blue or green.” If I wanted to track each color, I could write B or G above the box for the color she was asked to identify. This would allow me to track generalization of the skills from DTT.
This is not the data sheet I would use for discrete trials for a variety of reasons, or for independent work systems or schedule use in most situations. I will write my next post about choosing data collection tools to match the skill and environment and the different kinds of data you can use.
So, if you think this data sheet would be useful for your purposes, you can download it below. It is the same data sheet as the one from the last post and includes both of the examples in the workbook above.

Click here to download a blank pdf. Click here to download the Excel workbook.